
- Web technical
- SEO
- Web performance
PageSpeed Insights: Google’s tool for measuring page speed and Core Web Vitals
Reference
Paste a page’s address, click “Analyze,” and PageSpeed Insights delivers its verdict in under a minute: a performance score out of 100 for mobile and for desktop, the status of the Core Web Vitals measured on real visitors, then a list of opportunities to speed up the page. Free, with no sign-up and published by Google itself, it is the first tool developers, SEOs and front-end integrators open as soon as loading speed comes up.
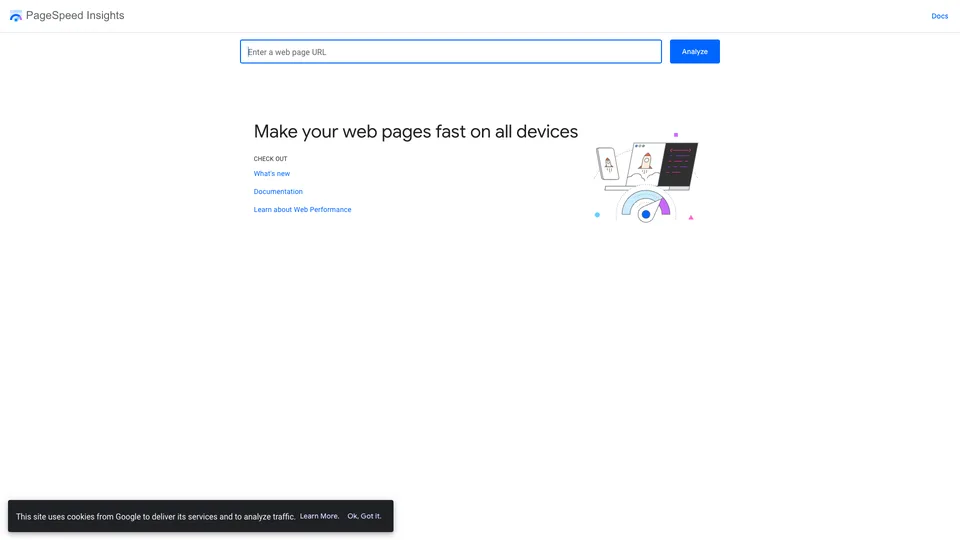
What is PageSpeed Insights?
Behind its single input field, PageSpeed Insights brings together two kinds of measurements that are worth telling apart. Field data comes from the Chrome User Experience Report (CrUX): from people browsing with Chrome who have agreed to share their usage statistics (Chrome on iPhone is excluded), Google collects the real loading time of pages over the last 28 days. The tool keeps the 75th percentile for three metrics, the Core Web Vitals: the time it takes to display the largest element (LCP, good under 2.5 seconds), responsiveness to clicks (INP, good under 200 milliseconds) and layout stability (CLS, good under 0.1). When the page doesn’t get enough traffic, it falls back on figures for the whole site, or shows nothing.
This rolling window has a practical consequence: a fix deployed today only shows up fully in the field data after about a month. To check a fix right away, rely on the lab test, then come back a few weeks later to confirm it in the real-user data.
Lab data, for its part, comes from Lighthouse, Google’s open-source auditing engine: a simulated load, on a mid-range smartphone and a mobile network for the mobile version, which produces a score out of 100 in four categories (performance, accessibility, best practices and SEO) and details what is slowing the page down, from oversized images to unused or render-blocking scripts. A free API returns the same results in JSON, so tests can be automated.
The tool belongs to the PageSpeed family, born in 2009 as a Firefox extension, then extended to an optimization module for the Apache server, and later for nginx. It took its current form in November 2018, built on Lighthouse and CrUX, and has followed the evolution of the Core Web Vitals ever since: on March 12, 2024, INP replaced FID as the responsiveness metric.
PageSpeed Insights at a glance
- Type
- Online tool and API
- Publisher
- Headquarters
- Mountain View, United States
- Tool family
- PageSpeed, introduced in 2010
- Engines
- Lighthouse and Chrome UX Report
- Real-user data
- Last 28 days, 75th percentile
- Free plan
- Yes, the entire tool
- Starting price
- Free, no account needed
What is PageSpeed Insights used for?
-
Measure a page’s speed
a performance score out of 100, on mobile and desktop, with a breakdown of display times.
-
Check your Core Web Vitals
LCP, INP and CLS measured on your page’s real visitors, with a pass or fail verdict.
-
Find what slows the page down
images to compress, scripts to defer, render-blocking resources, ranked by estimated time savings.
-
Check accessibility and basic SEO
three more Lighthouse scores, for accessibility, best practices and SEO fundamentals.
-
Automate your tests
a free JSON API to test pages in bulk or feed a dashboard.


PageSpeed Insights review
Reference
There is no talking about loading speed without going through it. PageSpeed Insights is the only free tool that shows, on a single screen, what Google actually knows about your visitors’ experience and what a simulated test reveals about the page. For a site that lives on search traffic, it is a valuable starting point: Core Web Vitals are among Google’s ranking signals, and this is where you see them the way Google measures them.
You still have to read the right number. The big score out of 100 comes from the lab test: it moves by a few points from one run to the next without the page having changed, and the mobile simulation, deliberately harsh, often drags it down. What matters are the Core Web Vitals measured on real visitors, at the top of the report; the lab score mainly helps you spot what to fix. Chasing a perfect 100 is rarely a good use of time.
The tool also has the limits of its simplicity. It analyzes one URL at a time, keeps no history and shows no detailed request-by-request view of the load. Small sites, lacking enough traffic, often only get lab data. And its very generic recommendations need a developer to be turned into concrete fixes.
For a one-off diagnosis, before a launch or after a redesign, you won’t find anything better for free. Long-term tracking and in-depth analysis happen elsewhere.
Strengths
- Completely free, with no account and no practical limit for manual use.
- Core Web Vitals as Google measures them, from real visitors.
- Field data and a simulated test in a single report, for mobile and desktop.
- Optimization opportunities ranked by estimated time savings.
- A free API to automate tests.
Weaknesses
- A lab score that varies from one test to the next, often harsh on mobile.
- No real-user data for pages and sites that lack traffic.
- One URL at a time, with no history or monitoring.
- No detailed loading waterfall, and no choice of test location or device.
- Technical recommendations that mean little to non-developers.
Is PageSpeed Insights worth it?
Yes, if you want to know, before a launch, after a redesign or a theme change, whether your pages load fast enough and pass the Core Web Vitals thresholds. It is free, instant, and these are Google’s own numbers: you might as well start there.
Not necessarily, if you need to track the speed of an entire site over time or understand exactly what is blocking the load. The Core Web Vitals report in Google Search Console, also free, groups the pages of the whole site. GTmetrix and WebPageTest offer a detailed request waterfall and a choice of test location, while monitoring services such as DebugBear test your pages continuously, for a subscription fee. Locally, Lighthouse opens directly in Chrome’s developer tools.
For history, Google also provides, at no cost, the CrUX data of any site in a Looker Studio dashboard (CrUX Dashboard), month by month, as well as a history API covering several months: enough to follow a Core Web Vitals trend without a subscription, as long as the site gets enough traffic.
How much does PageSpeed Insights cost?
Nothing. Google sells no plan at all: the online tool works without an account, and the API is free too, within usage quotas set per project.
| Plan | Per month | Access | Who it's for |
|---|---|---|---|
| Online tool | $0 | No account, one URL per analysis | Testing a page by hand |
| API | $0 | Free key recommended, per-project quotas | Developers, bulk testing, dashboards |
Source: official PageSpeed Insights documentation (API documentation, no paid plan), checked on October 31, 2026.
- The API works without a key, but Google recommends creating one, for free, in the Google Cloud console as soon as requests become frequent or automated.
- Request quotas are shown in the project’s Google Cloud console; Google offers no paid plan to exceed them.
FAQ
Answers to questions about PageSpeed Insights
Is PageSpeed Insights free?
Yes, completely. The online tool works without an account, and the API is free too, within per-project quotas.
Why does my score change with every test?
The score out of 100 comes from a simulated load, which is sensitive to network and server conditions at the time of the test. A few points of difference between runs is normal. The Core Web Vitals measured on real visitors, calculated over 28 days, are much more stable.
Why is there no real-user data for my site?
Field data comes from visitors who use Chrome. If the page, and then the whole site, don’t get enough traffic over the last 28 days, or if the page is not public and indexable, only the lab test is shown.
Should you aim for 100/100?
No. What matters to Google are the Core Web Vitals of real visitors: an LCP under 2.5 seconds, an INP under 200 milliseconds and a CLS under 0.1. A lab score above 90 is already considered good.
How do you improve your PageSpeed Insights score?
Start with the opportunities ranked at the top of the report, by estimated time savings: compress and resize images, defer non-essential scripts, reduce server response time and reserve space for elements that shift during loading. On an existing site, these fixes are a job for a developer or an agency.
Information checked on October 31, 2026