
- SEO
- Analytics and reporting
Data Studio (formerly Looker Studio): Google’s free tool for building client dashboards
Good tool
Data Studio, formerly Looker Studio, turns data from Google Analytics, Search Console, Google Ads or a plain Google Sheet into interactive reports that you build by drag and drop and share with a link, just like a Google doc. Agencies and consultants mostly use it to give clients a dashboard that is always up to date, without exporting a single file. Free and with no cap on reports, it is one of the most widely used reporting tools in digital marketing whenever the data comes from Google.
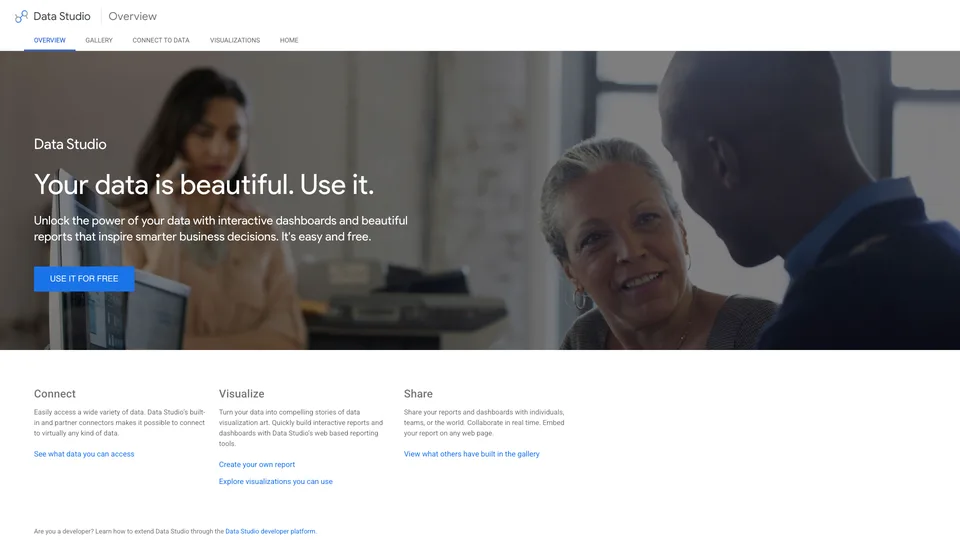
What is Data Studio?
Everything happens in the browser, with a Google account. You start by connecting a data source: Google’s own connectors (Google Analytics, Search Console, Ads, Sheets, BigQuery, YouTube…) come built in, and more than 1,300 partner connectors, built by third-party vendors, open the door to other platforms; in all, Google claims more than 1,400 possible sources. Next comes the report editor, a blank canvas where you drop tables, line charts, maps, gauges, date filters and text, across several pages if needed. Data is queried every time the report is opened, so the client always sees the latest numbers, without anyone copying them over. You can also embed a report in a web page or an intranet, and schedule it to go out by email.
The tool appeared in 2016 as Google Data Studio, first inside the paid Google Analytics 360 suite, then as a free version two months later. After Google closed its acquisition of Looker, an American business intelligence software company, in February 2020, the tool was renamed Looker Studio in October 2022 and folded into Google Cloud. The name caused confusion with Looker, the analytics platform for large enterprises: in April 2026, Google went back to Data Studio, with the paid version becoming Data Studio Pro. Reports, data sources and shared links were kept as they were, and the lookerstudio.google.com address now redirects to the new name.
Data Studio at a glance
- Type
- Online reporting tool (SaaS)
- Launched
- 2016, as Google Data Studio
- Current name
- Data Studio, since April 2026
- Publisher
- Google (Alphabet)
- Origin
- United States
- Headquarters
- Mountain View, California
- Data sources
- More than 1,400, according to Google
- Free plan
- Yes, unlimited reports and viewers
- Starting price
- Pro: $9 per user per month
What is Data Studio used for?
-
Connect your data sources
Analytics, Search Console, Google Ads, Sheets or BigQuery in a few clicks, and other platforms through third-party connectors.
-
Build client dashboards
a drag-and-drop editor for multi-page reports in your own colors, with date filters.
-
Track traffic and SEO
sessions, conversions, clicks and average positions for your sites on a single screen, updated automatically.
-
Measure your ad campaigns
Google Ads costs, clicks and conversions, plus other ad platforms through connectors, shown next to the site’s results.
-
Share and embed your reports
a view-only link for the client, real-time co-editing or a report embedded in a web page.
-
Send reports automatically
scheduled email delivery, and with the Pro version up to 200 schedules per report, in Google Chat or as alerts.
-
Ask your data questions in plain language
with Gemini, reserved for the Pro version, or with the conversational agents built in BigQuery.





Data Studio review
Good tool
Data Studio has an argument that’s hard to beat for anyone managing websites or campaigns: it costs nothing and speaks the language of Google’s tools natively. Connecting Analytics and Search Console, adding a few charts and sending the link to a client takes an hour the first time, and a few minutes after that by duplicating a template. For an agency that delivers the same dashboard to dozens of clients every month, it’s often the most sensible solution, which is why you see it everywhere.
The numbers shown are those of the source tools, not estimates: Data Studio doesn’t create any data, it formats it. A report’s reliability therefore depends entirely on how Google Analytics or the conversion tags were set up upstream. A polished dashboard plugged into shaky tracking is still wrong.
As the report grows, the tool struggles. A page packed with charts querying Google Analytics can take many seconds to load, or even show errors when Google’s data access quotas are exceeded. Combining several sources (ad spend with a sales file, for example) goes through data blending, which quickly gets tedious and is limited to five sources sharing a common key. And as soon as you need numbers from Meta, LinkedIn or a CRM, you usually need a paid third-party connector, which ends up costing more than the tool itself. Those connections aren’t always stable either: an expired authorization or a broken connector, and the client’s dashboard shows up empty without warning.
Formatting, finally, quickly shows its limits. The chart templates cover common needs, but a truly custom presentation (fine-tuned layout, unusual charts, complex calculations) calls for workarounds or community visualizations.
The Pro version doesn’t solve those limits: it’s aimed at teams that want reports to belong to the company rather than to an employee’s account, to manage permissions through team workspaces, to get support and to use Gemini. For a freelancer or a small agency, the free version is more than enough. Beyond a certain volume, or for real data modeling work, business intelligence tools are the better place to look.
Strengths
- Completely free, with no limit on reports, pages or viewers.
- Native, instant connection to the main Google tools: Analytics, Search Console, Ads, Sheets, BigQuery.
- Sharing as simple as a Google doc, with real-time co-editing and always-current data for the client.
- Easy to get started, with templates you can duplicate from one client to the next.
- An ecosystem of more than 1,300 partner connectors to go beyond Google.
Weaknesses
- Reports that slow down noticeably as charts and data pile up.
- Google Analytics access quotas that can make charts fail on heavy reports.
- Limited and unintuitive data blending, far from a true business intelligence tool.
- Non-Google sources that often require paid third-party connectors, and connections that sometimes drop.
- Formatting and chart customization that quickly hit a ceiling outside common uses.
- No support on the free version, and a name that has changed twice, enough to get lost in the documentation.
Is Data Studio worth it?
Yes, if your data comes mostly from Google and you want to give your clients, or your leadership team, a live dashboard rather than a monthly PDF. Freelancers, SEO and PPC agencies, small businesses tracking their website: the tool covers the essentials for free, and the Pro version becomes worthwhile when a team needs to keep control over dozens of shared reports.
Not necessarily, if your reports rely on many non-Google ad platforms and services, or if you want turnkey white-label reporting. Agency-focused tools such as AgencyAnalytics, DashThis, Swydo or Whatagraph pull those sources together with no connector to add, for a subscription. For more advanced data analysis, Power BI, Tableau or Looker, Google’s enterprise platform, play in a different league.
How much does Data Studio cost?
The tool itself is free, both for building and for viewing reports. Google only charges for the Pro version, in dollars, per license: one license per person who creates or edits Pro content, per Google Cloud project the subscription is attached to. People who only view reports don’t need one.
| Plan | Per month | Included | Who it's for |
|---|---|---|---|
| Data Studio (free) | $0 | Unlimited reports, data sources and viewers | Freelancers, agencies, small businesses |
| Data Studio Pro (project subscription) | $9 | Team workspaces, company-owned content, Gemini, support | Teams managing many shared reports |
| Data Studio Pro (organization subscription) | Custom pricing | Billing based on monthly active users | Large organizations, through a sales rep |
Source: official Data Studio (formerly Looker Studio) pricing, checked on October 31, 2026.
- The $9 price is per user, per project, per month: someone who belongs to two projects counts twice. Google notes that it varies with the length of the commitment, without publishing any other amount.
- Licenses are billed monthly, whether they are used or not, to a Google Cloud billing account.
- A 30-day free trial is offered, with no user limit; billing then starts automatically.
- Third-party connectors to non-Google platforms are often paid and billed separately by their vendors.
FAQ
Answers to questions about Data Studio
Is Data Studio really free?
Yes: creating, sharing and viewing reports costs nothing, with no limit on how many. Only the Pro version, designed for teams, is paid, at $9 per user, per project, per month. Third-party connectors to non-Google platforms, however, may be billed by their vendors.
Are Looker Studio and Data Studio the same tool?
Yes. Google Data Studio became Looker Studio in 2022, then Google gave it back its original name, Data Studio, in April 2026. Existing reports and links didn’t change.
What’s the difference between Data Studio and Looker?
Data Studio is for building self-service reports and dashboards, for free. Looker is a business intelligence platform for enterprises, built on a centralized data model and sold on a quote basis. They are two separate Google products.
Why is my Data Studio report so slow?
Every chart queries the source when the report opens. With many charts connected to Google Analytics, loading slows down and data access quotas can be reached. Cutting the number of charts per page or working from a copy of the data in Google Sheets or BigQuery makes a big difference. The tool also offers its own fix: the Extract Data connector stores a subset of the source, up to 100 MB, refreshed at the interval you choose, and charts read that copy instead of querying Google Analytics every time the report opens.
Information checked on October 31, 2026